
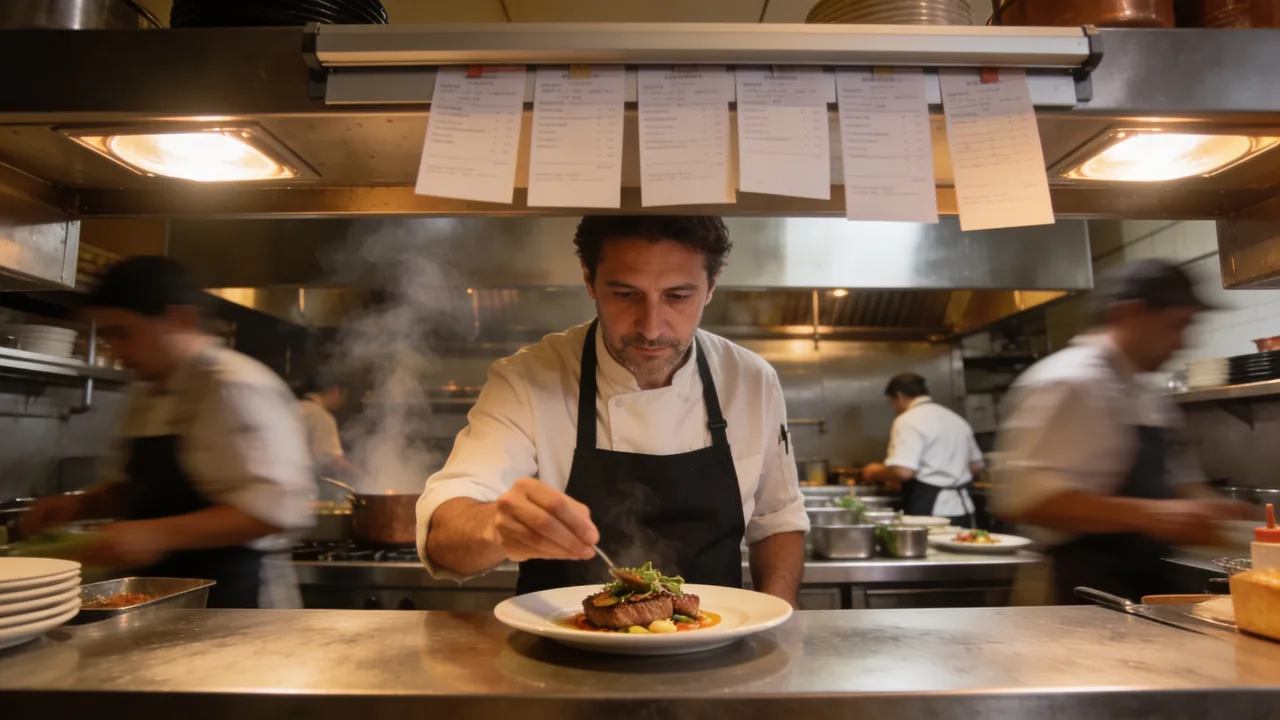
The National Restaurant Association projects $1.55 trillion in restaurant and foodservice sales for 2026 across more than 1 million U.S. locations, with industry employment reaching 15.8 million. Adjusted for inflation, real sales growth is forecast at just 1.3 percent — a growing industry with very little room in the middle.
How big is the restaurant industry in 2026?
The National Restaurant Association's 2026 State of the Industry report puts total restaurant and foodservice sales at a projected $1.55 trillion for the year, spread across more than 1 million outlets. Employment is forecast to reach 15.8 million jobs, up from 15.7 million, as operators add more than 100,000 positions.
Independent verification comes from the Census Bureau, which tracks the same activity monthly. Food services and drinking places sales were up 3.8 percent in June 2026 against June 2025, and totaled $603.9 billion over the first half of the year — also 3.8 percent ahead of the same six months in 2025. Two independent measures agreeing on the direction is a stronger signal than either one alone.
Why are sales up but margins down?
Because almost all of the sales growth is price, not plates. The Association forecasts nominal sales growth for 2026 but real growth of only 1.3 percent once inflation is stripped out. Menu prices have risen to cover higher costs, so the dollar figure climbs while the number of meals served barely moves.
The operator survey shows what that feels like from behind the counter. 42 percent of operators said their restaurant was not profitable last year, 60 percent reported softer customer traffic, and more than 9 in 10 named food, labor, insurance, energy, and card swipe fees as significant challenges. Demand itself is not the problem: more than 7 in 10 consumers say they would eat out more often if they had the disposable income.
What the 2026 outlook means for an independent operator
A thin-margin year rewards precision over ambition. When real growth is around 1 percent, the gap between a restaurant that makes money and one that does not is usually a handful of controllables: food cost percentage, labor hours scheduled against actual covers, and the payment-processing and delivery commissions that come off the top before anything reaches the P&L.
It also changes how you should think about capital projects. In a year when nearly three quarters of operators plan to hire but expect trouble finding experienced managers and chefs, equipment that reduces the skill required to execute a dish consistently is worth more than equipment that simply adds capacity. Our guide to restaurant equipment financing works through sizing a purchase against the hours or covers it actually returns.
How restaurants fund equipment, payroll, and slow seasons
Restaurants have the cash flow profile funders understand best: daily card receipts, predictable weekly cycles, and a clear seasonal shape. That makes revenue-based structures straightforward to underwrite, and it is why a restaurant business loan is often approved on deposit history rather than on collateral. The discipline is matching the repayment shape to the revenue shape — a fixed daily remittance is punishing in February if your sales are built for July. Our roundup of the best restaurant funding companies compares how different funders handle exactly that.
The Broker Shop is a funding broker, not a funder — we put more than 50 lenders in competition for one application instead of lending money ourselves. That means you see the structures you actually qualify for side by side and pick the payment schedule that matches how the money comes back in. It is free to apply, and checking your options won't affect your credit score.
Frequently Asked Questions
See what you qualify for
One 2-minute application is matched to the funders whose guidelines you meet. It's free, and checking your options won't affect your credit score.
See What I Qualify For →The bottom line: Restaurant sales keep setting records in dollar terms while real growth is close to flat, so in 2026 the operators who do well are the ones controlling food cost, labor hours, and processing fees rather than the ones chasing volume.
Sources: National Restaurant Association — 2026 State of the Restaurant Industry (press release) · National Restaurant Association — State of the Industry research report · U.S. Census Bureau — Advance Monthly Retail Trade Survey, June 2026 (CB26-113)
Found these figures useful? You are welcome to cite or link to this page. Suggested attribution: “Restaurant Industry Statistics 2026,” The Broker Shop — thebrokershopinc.com/restaurant-industry-statistics-2026.html. Every figure links to its original primary source.